Section 5.1 Search Navigation Tree
Users can navigate through records by content structure,
saved searches, quality control, tags,
workflow, clusters, or view data graphically from a
search in a saved report. Administrators decide which navigation features are
available to end users.
Section 5.1.1 Content Structure
Default navigation tree structure, which is organized by
Project, Collection, and then session.
Section 5.1.2 Saved Search
Users can save a search and assign the search a name by
selecting save search at the bottom left of the search results grid.. The Saved
search navigation tree is filtered to display only those records that match the
search criteria. Each saved search is displayed in the Navigation Tree by the
name assigned to the search when saved.
Section 5.1.2.1 Delete Saved Search
An end user can delete a saved search by selecting the delete icon that appears next to the name of the saved search in the Saved Searches Navigation Pane.
Section 5.1.3 Quality Control (Roadmap)
Quality Control is like a saved search in that it filters the results to those boxes requiring a QC correction.
 Section 5.1.4 Tags
Tags are also like a saved search in that it filters the results based on the tags assigned to the boxes during review. Each tag is displayed in the Navigation Tree.
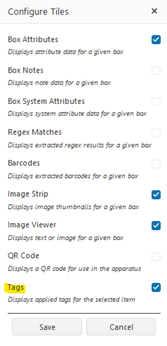
Section 5.1.4.1 Enable Tag Tile
Select Configure Tiles to enable the Tagging Tile.
Section 5.1.4.2 Assign a Tag
Use the drop-down window to add a tag to the image or box. If there are no options in the drop-down menu, contact your project manager.
Section 5.1.4.3 Add a new tag
Tags are created and associated with a specific collection. Refer to Section 9.2.6.6 Add Tags to a Collection for instructions on how to add new Tags to a Collection.
Section 5.1.5 Workflow (Roadmap)
Records are displayed in the Navigation Tree according to
their state or status in the workflow. For example, records in step 2 of the
defined workflow will appear under the heading (name) for step 2 while records
that have been process through step 2 and are currently in the workflow stage
of step 3 will appear under the heading (name) for step 3 and so on.
Section 5.1.6 Clusters (Roadmap)
Records are displayed in the Navigation Tree according to
the cluster(s) they are a part of. Clusters are a grouping of several similar things; in the
case of OCR technology the similar things are terms (words). The more frequent
the term is found in the OCR the more prominent the cluster as shown in the
Keyword Frequency report found on the dashboard.
Section 5.1.7 Reports (Roadmap)
The navigation tree is organized based on the configuration of a particular report.
Related Articles
Section 6.4 Navigation Tree List
Section 6.4 Navigation Tree List List of the records sorted to meet the criteria from a search, newly added items, or open tasks. If you access Review directly from the Page Navigation Drawer, the navigation tree has all the records in the system you ...Section 5 Search
Search Search is designed to conduct searches in a systematic way for information specified in a search query. The Search Page has a navigation tree, google-like search bar, advanced search, and a results grid which can be saved, edited, and/or ...Section 6.1 Review Filters
Section 6.1 Review Filters Different filters can be applied to the Review Results. These filters are automatically applied based on how a user accesses the Review Page. Section 6.1.1 Open Review from Search You can perform a search which will filter ...Section 10.2.2 Regex
Section 10.2.2 Regex A Regex or regular expression (sometimes called a rational expression) is a sequence of characters that define a search pattern, mainly for use in pattern matching with strings, or string matching. Regular expressions are a ...Section 10.2 Automation
Section 10.2 Automation Automation describes a wide range of technologies that reduce human intervention in processes. Human intervention is reduced by predetermining decision criteria, sub-process relationships, and related actions — and embodying ...